


Insurance
MSIG Insurance 2024
Annual Report
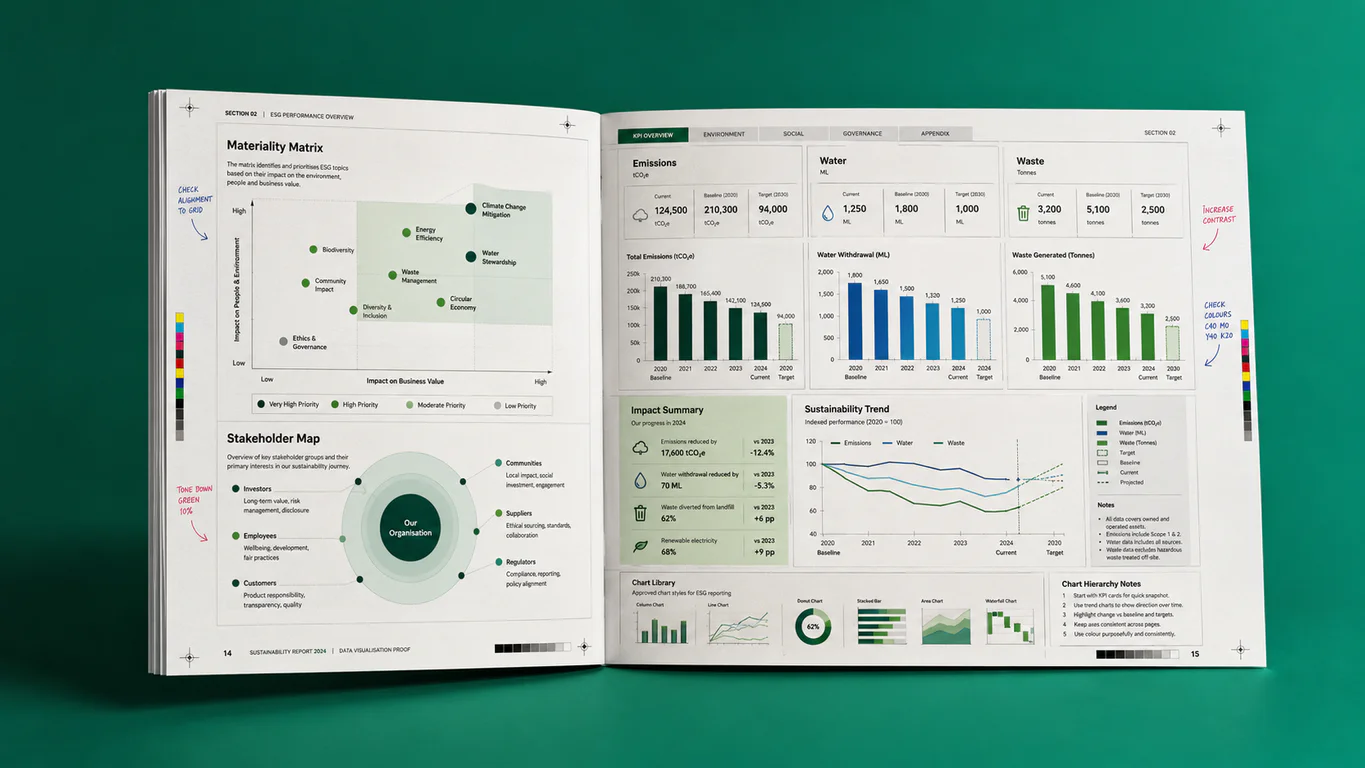
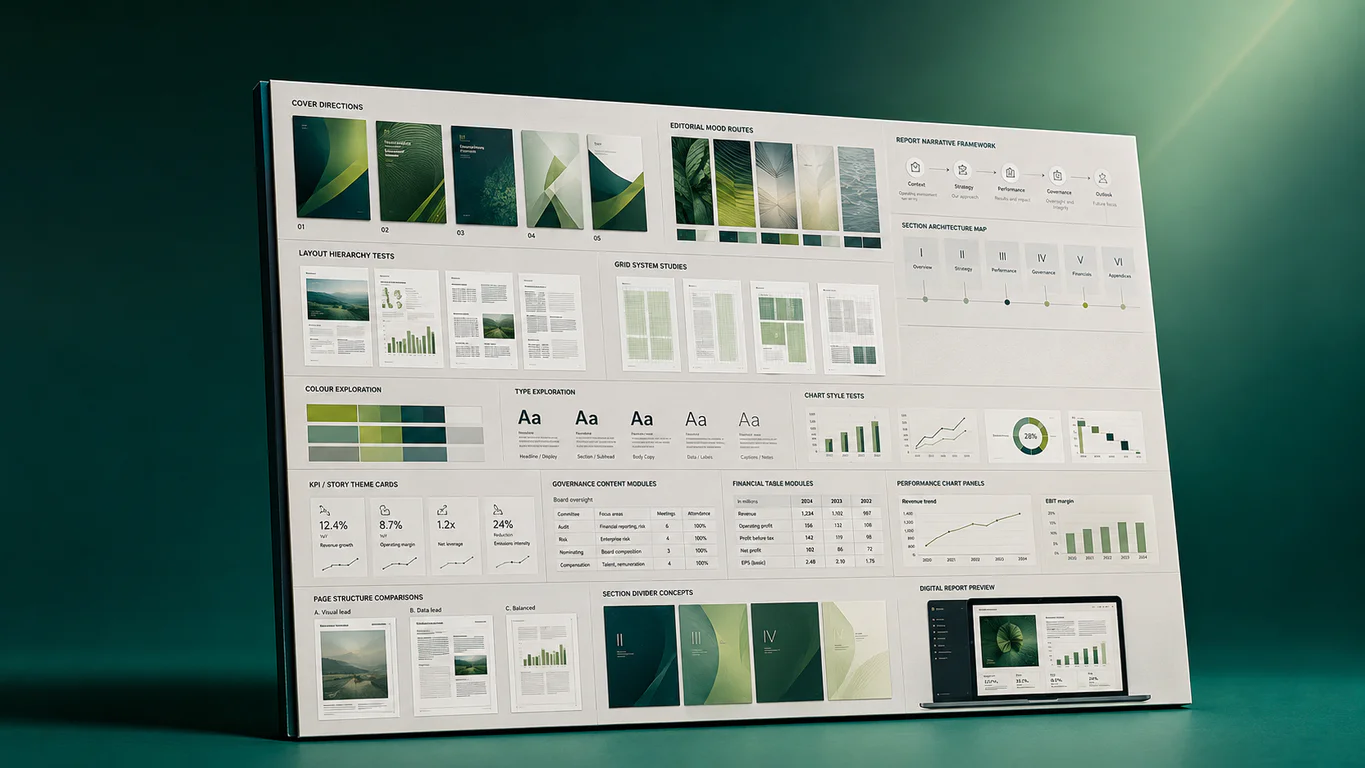
Data visualization presenting corporate governance and financial performance for an insurer.
View Case Study
Walk Production provides quarterly report design and file preparation support for the recurring quarterly reports that listed companies and investment-focused entities send to their stakeholders. We coordinate project management, copywriting, layout and design, infographics, proofreading, and digital output from one account team.
Quarterly reporting runs on a fixed cadence, so many companies engage Walk Production for all four quarters in a year and work to a repeatable template. Financial and disclosure content is reviewed by your reporting team and advisers. We design and lay out the report, while the financial data and reporting standards stay with your team.
Walk Production does not write the financial content. Your team supplies the figures and your reporting advisers review the disclosures. We design, lay out, and visualize what you provide. A reusable template is built in the first quarter we work on, so later quarters move faster. Packages cover one quarter, four quarters, or quarterly plus annual.
Six services across the quarterly report cycle: project management, copywriting coordination, layout and design, infographics and data visualization, proofreading, and digital output. One account team carries each quarter from data handover through to publication.
We manage the quarterly schedule against your results announcement date. Milestones, file handovers, and approval points are mapped so the report moves on a predictable timeline each quarter. One account team coordinates your finance team, company secretariat, and reporting advisers.
We coordinate the written sections of the quarterly report, including management commentary, operational updates, and quarter highlights. Financial and disclosure content is provided by your team and reviewed by your reporting advisers, while we keep tone and structure consistent with previous quarters.
Editorial layout for the full quarterly report, from cover and contents through to the financial tables. We design a reusable template in the first quarter so later quarters reuse the same grid, type, and styles, with attention to readability and visual hierarchy.
We turn client-supplied figures into charts, graphs, and infographics that make quarterly performance easier to read. Data sets, results, and metrics are client-supplied; we visualize the numbers you provide and keep chart styles consistent from quarter to quarter.
Proofreading of layout copy, headings, captions, and figure labeling before each quarter is published. We check the report against the approved copy and previous quarters. We handle translation coordination and proofreading where these are included in scope.
Digital output formats for online publication, including final PDF and web-friendly PDF with navigation and searchable text. Output is prepared so each quarterly report can be published and distributed on schedule.
A structured process supports quality outcomes and on-time delivery for each results announcement. The first quarter sets up the template; later quarters reuse it and move faster.
In the first engaged quarter we agree the report structure, design direction, and approval workflow, then build a reusable quarterly template. Later quarters skip this step and start from the established template.
Your team hands over the quarter’s financial figures, results, and written input. Financial and disclosure content is reviewed by your reporting advisers. We confirm what is final and what is still pending.
We place the quarter’s content into the template and visualize client-supplied figures as charts and infographics. Layout follows the established grid so the report stays consistent quarter to quarter.
Review rounds with your team and reporting advisers. We refine layout and visuals based on feedback until the quarter’s report is approved for publication.
A proofreading pass on layout copy, captions, and figure labeling, checked against approved content and previous quarters before files are prepared.
We prepare print-ready and web-friendly output formats and hand over files so the quarterly report can be published on schedule.
Choose the package that matches your team’s capacity and reporting cadence. All packages include project management and multiple revision rounds. Pricing scales with scope: request a quote.
We design quarterly report formats to suit different stakeholder audiences and publication channels.
Recurring report covering quarterly results, financial tables, and management commentary for shareholders and investors.
Operational and business update presenting the quarter’s progress, milestones, and outlook for stakeholders.
Slide-format quarterly summary for results briefings and investor presentations, with charts from client-supplied figures.
Web-friendly quarterly report with navigation and searchable text, prepared for online publication and stakeholder sharing.
Data visualization presenting corporate governance and financial performance for an insurer.
View Case Study
A renewable-energy annual report visualizing revenue growth and project portfolio for a listed group.
View Case Study
An annual report with copywriting that unifies financial performance and sustainability commitments.
View Case StudyQuarterly reporting repeats four times a year. We design a reusable template in the first quarter so later quarters reuse the same grid, type, and chart styles, and each quarter moves on a predictable schedule.
When the same team handles every quarter, the report stays visually consistent through the year. Charts, layout, and tone match from one quarter to the next without rebriefing from scratch.
Financial and disclosure content is reviewed by your reporting advisers. Walk Production designs and lays out the report and visualizes client-supplied figures; the financial data and reporting standards stay with your team and advisers.
We work backwards from your results announcement date to set realistic milestones. Our project management keeps your finance team, company secretariat, and advisers aligned for on-time delivery.
Our primary reporting service. Integrated annual report design and copywriting for SGX Mainboard and Catalist issuers and investment-linked groups. Quarterly and annual reporting can share one visual system.
View ServiceDesign for sustainability and ESG reports aligned to GRI, ISSB, and SGX requirements, for listed companies and large organizations.
View ServiceData visualization and infographics that turn client-supplied figures into clear visuals.
View ServiceThe more context you share, the sharper our first response. A rough scope and timeline are enough to begin.