Introduction
Sunview Group Berhad is a solar and renewable-energy group listed on Bursa Malaysia’s ACE Market. It builds solar photovoltaic plants under EPCC contracts, and it owns solar facilities that earn recurring income. Its 2024 annual report runs to 200 pages under the theme Brightening Lives with Clean Energy, covering the financial year that ended March 31, 2024.
Walk Production handled the annual report project from concept development through visual and layout design, visual data storytelling, and print-ready file handoff.
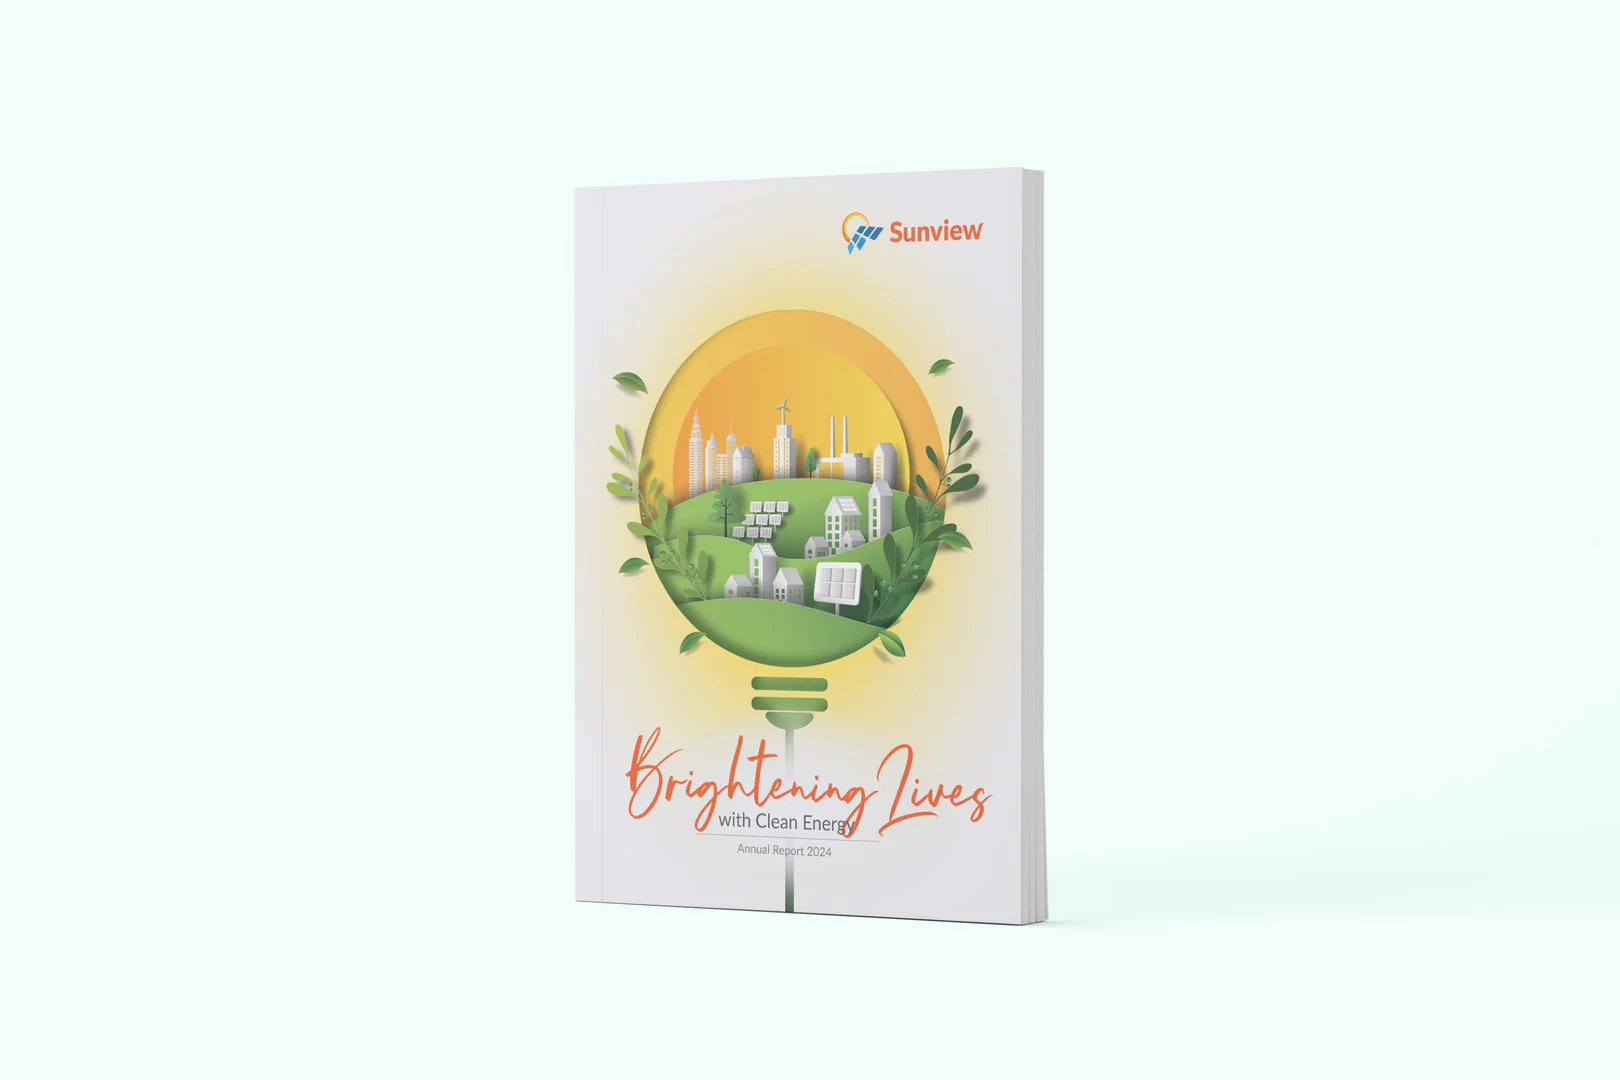
A cover built from paper layers
The cover places a papercut-style scene inside the glass of a light bulb. Skyscrapers, a wind turbine, and factory chimneys stand at the back, while houses and rows of solar panels sit on rolling green hills in front. An orange sun glows behind the scene, and green leaves curl around the bulb.
The theme runs beneath it in two parts. “Brightening Lives” is written in a large orange script, and “with Clean Energy” follows in a plain sans serif, with “Annual Report 2024” set small under a thin rule. The Sunview logo sits alone at the top right.
Five parts, two kinds of opener
The contents page splits the book into five parts: The Company, The Story, How We Are Governed, The Financials, and Other Information. The same papercut hills return under a sunlit sky on the openers for The Company and The Story.
The openers for How We Are Governed, The Financials, and Other Information switch to gray, with a white wave along the lower edge. All five set their titles in a large script, so the lettering from the cover carries through the book.
Headline figures and a milestone timeline
Performance Highlights gives four figures their own circles: revenue of RM465.87 million, net assets of RM140.45 million, RM1.16 billion in awarded projects, and an unbilled order book of RM219.01 million. The next page carries a table of key financials and ratios for 2021 through 2024.
Corporate Milestones spreads across two pages as a timeline set below the illustrated landscape. It starts in 2013, when its subsidiary Fabulous Sunview began operating and secured rooftop projects on residential and commercial buildings. It ends in 2024 with the group’s first overseas EPCC contract, for a 20 MWac solar plant in Bulgaria.
Charts inside the sustainability statement
Our infographic design work carries the numbers in the Sustainability Statement. A combined bar and line chart sets quarterly revenue and net profit against profit margin for FYE 2023 and FYE 2024. Further charts show customer satisfaction scores and break the 171-person workforce down by gender, ethnicity, and age.
Print-ready files for the vendor
Walk Production prepared print-ready files from pre-press checks through final file handoff to the client’s appointed printing vendor. Color accuracy, paper selection, and finishing specifications were documented with the files, and the vendor produced the printed report.
What the finished report gives its readers
The Story gathers the Chairman’s Message, the management discussion and analysis, and the Sustainability Statement in one part. A shareholder reads the year’s narrative before reaching governance and the audited accounts.
Revenue rose 34.26% to RM465.87 million. The report presents annual totals and quarterly performance. The clean-energy landscape from the cover appears again on the highlight pages, so the theme stays in view between the numbers.
Related Questions
What makes annual report design for renewable-energy companies distinctive?
Renewable-energy annual reports typically feature approved project imagery, plant and site visuals, and capacity or generation data alongside detailed financial reporting. Design must balance large-scale project visuals with financial statements and governance disclosures effectively. The visual approach needs to communicate both technical capability and corporate professionalism to diverse stakeholder audiences.
How is project portfolio data presented in annual reports?
Project portfolios are presented through approved imagery, capacity figures, timeline summaries, and location information in structured formats. Visual layouts help stakeholders understand project scale, status, and geographic distribution. In Sunview Group Berhad’s 2024 report, the milestones timeline runs from rooftop projects on residential and commercial buildings in 2013 to large-scale solar plants and a first overseas contract in 2024. Clear formatting allows readers to compare projects at a glance.
Why is print quality important for annual reports?
Print quality reflects corporate standards and professionalism in the eyes of stakeholders, investors, and business partners. For listed companies, the annual report is a primary shareholder communication tool. Final publication quality directly influences perceptions of corporate credibility, attention to detail, and overall commitment to professional standards across all business communications.
What sections are typically included in a renewable-energy firm’s annual report?
Typical sections include financial statements, management discussion, project portfolio, corporate governance, sustainability reporting, board profiles, and market outlook commentary. These sections are structured to meet regulatory requirements while providing stakeholders with a full view of the company’s operational performance and strategic direction within the solar and renewable-energy sector.
How do infographics help communicate financial performance?
Infographics convert financial tables into visual formats such as charts, trend indicators, and comparison graphics for easier reader comprehension. This helps readers quickly identify key performance trends and year-on-year changes in results. Visual data presentations and supporting report copywriting make annual reports more accessible to non-financial stakeholders and support faster understanding of corporate performance.