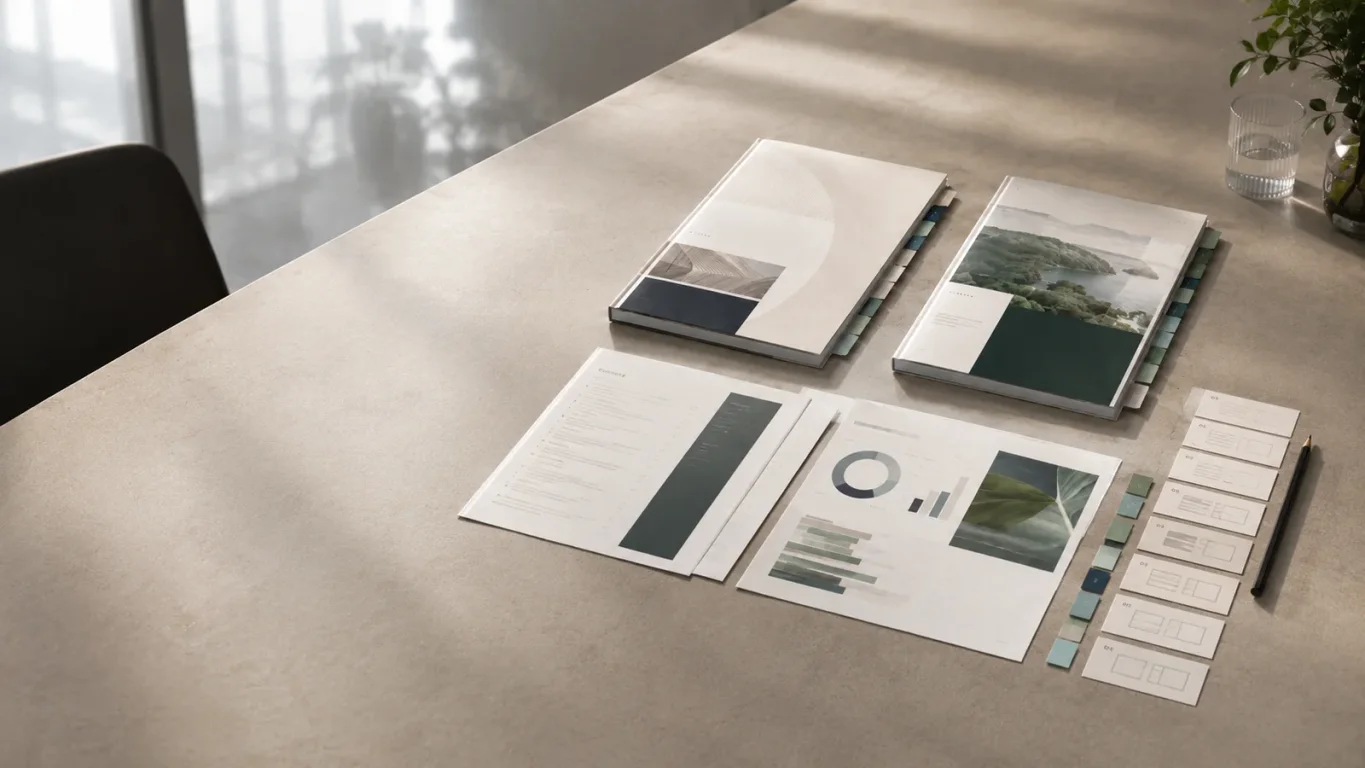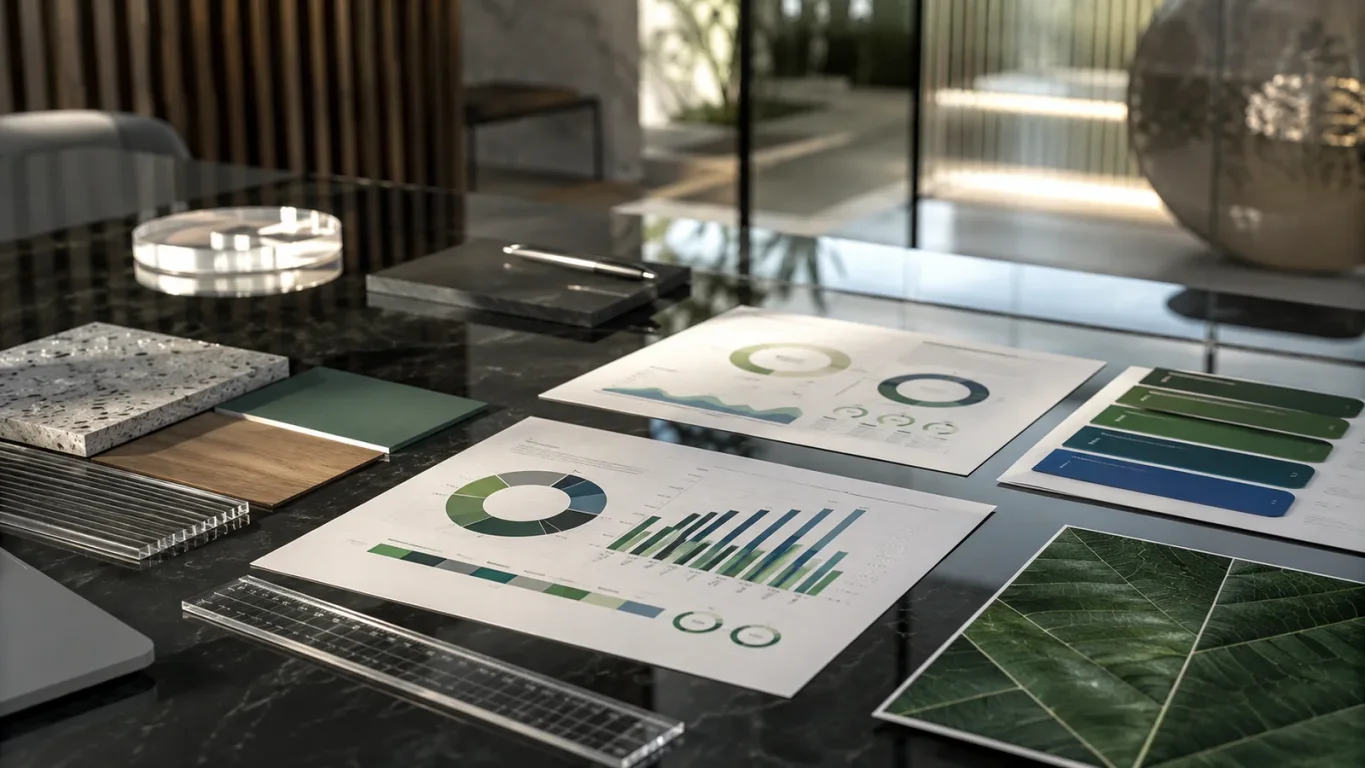

Video transcript
The reports that impress a Singapore boardroom are rarely the most decorated. They are the most legible, cover to back. One visual system, held consistent, keeps a reader moving. Here is how to design a 2026 report they stay with. Visual trends here means recurring presentation patterns. How charts are styled, tables built, section openers placed. Not decoration; the test is how an analyst moves through it.
Most Singapore reports are read on screen before print circulates. So build screen first, with charts legible at 70% zoom, then derive print. A tagged PDF is the baseline; a microsite suits STI-constituent issuers. The highlights spread is the most skimmed page in any report. Lead each panel with one dominant figure, the 5-year table beneath it. Use absolute figures for scale, or index to 100 for growth.
Present ESG data like financials: headline figure first, then the table. Scope 1 and 2 emissions are reported by all SGX issuers from FY2025. Structure the metrics against the GRI Standards under the ACRA timeline. Charts lean on color to separate categories, but color alone is not enough. Under WCAG 2.2, chart segments need 3:1 contrast against each other. So carry it in a second channel, a pattern or a direct label.
A disciplined grid does the heavy lifting: predictability, not minimalism. A 12-column grid resolves cleanly into 2, 3 and 4-column zones. One body face, two or three heading levels, no decorative fonts. One integrated report or two documents, use one visual system across both. A section bolted on in a different palette reads as two publications. A reader front to back notices the shift within 2 pages.
Normal text needs 4.5:1 contrast, large text 3:1. That is separate from the 3:1 floor for the chart shapes. Add alt text and a tagged PDF to keep the file navigable. A few patterns quietly date a report; a critical reader spots each. Recycled photos, FY2023 reused in FY2025, and dense undesigned tables. 3D charts hide the number, and a mismatched cover wastes the opening.
The best first step: align the visual system with the content architecture. Set it at concept stage and it holds to final proof. Legible, cover to back, is the report a shareholder stays with. Plan yours with Walk Production.
The annual report examples that impress a Singapore boardroom are rarely the most decorated. They are the most legible, front to back. A clear visual system, held consistent throughout, is what separates a report a shareholder navigates from one they set aside after the first ten pages.
This article looks at the presentation patterns that define strong annual report examples in 2026: the layout decisions, the grid discipline, the data visualization approach, and the small typographic choices that decide whether a reader stays. It is written for communications, investor relations, and design teams preparing a Singapore listed-company report, or looking to raise the standard of the next cycle.
A note on scope. Walk Production is an integrated creative agency that designs and writes annual, sustainability, and integrated reports for listed companies and organizations across Singapore and Asia-Pacific. The report itself is written and designed by our own team. Sustainability consulting is available too, with the consultant on the project appointed by you or drawn from our partner panel. Audit, independent assurance, and legal advice are not part of our work and stay with your appointed providers. This piece is about how to present report content clearly. Confirm your reporting obligations against the official SGX and ACRA sources cited below.
What do strong annual report examples have in common?
The strongest annual report examples share one trait: a single visual system carried from cover to back-of-book. Layout, typography, color and chart styling stay consistent, so the financial and sustainability content functions as one publication instead of two reports filed together.
That consistency is easy to name and hard to hold across a 150-page production timeline with separate content owners: a finance team, a sustainability team, and an external auditor each working to their own schedule. The reports that hold together define a visual system at concept stage and enforce it through every proof round, rather than letting each section settle its own look as it arrives.
A point on terms, because it matters for what this piece is and is not. “Visual trends” here means recurring presentation patterns: how charts are styled, how tables are structured, how section openers are used, how hierarchy guides the reader through dense disclosure. It is not a reference to what Walk Production sells. The best annual report examples for Singapore are judged by one practical test, which is how well a shareholder or an institutional analyst moves through the document.
For a full grounding in what the two documents cover and how Singapore’s climate reporting timeline fits in, see our guide to annual reports and sustainability reports for Singapore companies. The regime is its territory; the design lane is ours.
Why are 2026 annual reports designed for the screen first?
By the time a printed copy circulates widely, most corporate reports have already been read on screen, so the sound approach is to build the layout screen-first: clickable contents, scannable spreads, charts legible at thumbnail size, then derive the print edition from the same master. Working in that order is more efficient and produces a cleaner result than laying out for paper and retrofitting the digital file.
Institutional analysts and IR audiences open the PDF or the microsite long before a printed copy lands on any desk. A hyperlinked table of contents, section anchors, and charts that hold up at 70 percent zoom are what a professional reader now treats as the floor, not as polish. Mobile and tablet legibility belongs in the same floor: an emissions chart sized for an A3 spread but never checked at phone width regularly collapses in the hand.
The production-order point is worth making concrete, because reversing it costs more than people expect. The digital master should be the responsive, tagged file: a logical reading order, a proper tag tree, bookmarks, and live internal links from the contents page and cross-references. The print edition is then derived from that master. Do it the other way round, lay out for print and export a PDF at the end, and the export typically strips the tag tree and flattens the internal links, so the digital edition arrives without the structure that made it navigable. Rebuilding that structure after the fact is slower than designing it in from the start.
Two digital formats are common among Singapore issuers. An interactive, tagged PDF with bookmarks and a logical reading order is the baseline: lower cost, easier to produce, widely compatible. A responsive microsite with animated data suits STI-constituent companies or issuers reaching for a broader retail audience. Whichever route a company takes, the digital edition is the master the printed copy is drawn from.
One place print still leads is the cover. A foil, an emboss, or a spot-UV finish is a physical effect the screen edition cannot reproduce, so the printed cover can carry a tactile signature the PDF only suggests. That is the exception, not the rule, and it does not change the order of work: the cover is still designed inside the same visual system, then given its finish for print.
How do you design a financial-highlights spread that earns its page?
The financial-highlights spread is the most photographed and most quickly skimmed page in any Singapore report, so it has to reward a three-second glance and a three-minute read at once. The discipline is to lead with a small number of dominant figures, give each one room, and put the supporting detail directly beneath it rather than crowding everything onto one grid.
Make the headline-then-table pattern literal. Each panel of the spread carries one dominant number, set large, with its label and unit close by: revenue, profit before tax, earnings per share, net gearing, whichever the board most wants read first. The five-year summary table sits below or beside those panels, supporting the headline figures with detail. A reader who only glances takes the figures; a reader who stays gets the trend.
Then decide between an absolute and an indexed five-year trend, because the two say different things. Absolute figures answer “how big,” and suit a business where scale is the story. An indexed trend, rebased so the first year equals 100, answers “how fast,” and is the fairer view when you are comparing the growth of lines that sit at very different sizes. Pick the one that matches the message, and do not switch between the two within the same spread without telling the reader.
A common instinct is to give revenue its own chart and margin another. Resist it. A revenue bar and a margin line drawn on one shared axis-pair, bars reading off the left axis and the line off the right, lets a reader see growth and profitability move together or apart in a single glance. Two separate charts force the eye to travel and the brain to hold one picture while reading the other.
Restatements are where a clean highlights table usually breaks. When a prior-year figure has been restated, the scan should survive it: mark the affected figure with a single footnote indicator, keep the cell itself uncluttered, and place the explanation in a footnote line beneath the table rather than wedging it into the cell. The reader skimming the row still gets a clean number; the reader who needs the reason finds it without the table losing its shape.
How should sustainability and ESG data be presented in a report?
Present ESG data the way you present financial data: headline first, then the supporting table. With Scope 1 and 2 emissions now reported by all SGX-listed issuers from FY2025 under the ACRA climate reporting requirements and timeline, an emissions chart or ESG dashboard is read in seconds. Its design decides whether the rest of the section gets read. Confirm the current phasing against the ACRA timeline before sign-off, as the requirements are revised periodically.
Sustainability metrics structured against the GRI Standards benefit from the same approach. GRI’s Universal, Sector and Topic Standards give a well-organized report its content architecture; the design team’s job is to make that architecture visible. A five-year emissions trend is often the quickest element for a reader to grasp in the sustainability section, so it earns the prominence a headline figure earns in the financials.
Three presentation habits translate well from financial data to ESG data:
- Lead each ESG spread with the takeaway figure, then the detail table below it.
- State units once, at the top of each chart or table column, not repeated in every row.
- Show year-on-year comparatives. A single year in isolation tells a reader very little.
There is one chart-specific rule the financial sections rarely force you to confront, but the ESG sections do, because emissions and intensity charts lean hard on color to separate categories. Distinct colors are not enough on their own. Under WCAG 2.2 Success Criterion 1.4.11 Non-text Contrast, the parts of a graphic a reader needs in order to understand it have to reach a contrast ratio of at least 3:1 against the colors next to them. That is a different test from the 4.5:1 floor for text, and it applies to the chart segments themselves, not only to their labels.
The practical failure is easy to picture. Two adjacent bars distinguished only by a mid-blue and a slightly different mid-blue may look fine to the designer on a calibrated monitor and pass nothing at 3:1. For a low-vision reader, and for anyone holding a grayscale print of the report, the two categories merge and the chart stops communicating. The fix is not to abandon a restrained palette. It is to choose hues that hold a 3:1 separation, or to carry the distinction in a second channel as well, a pattern fill or a direct label on each segment, so meaning never rides on color alone.
Frameworks set what to disclose. This guide is about presenting it clearly.
SGX Listing Rule 711A and Rule 711B, the ACRA ISSB-aligned timeline, and the GRI Standards govern what a Singapore listed company discloses. They are referenced here as context for clear presentation, not as compliance guidance. Confirm the current rule text on the SGX Rulebook, and your obligations with your advisers, before sign-off.
What layout and grid ideas make a report easier to read?
A disciplined grid does the heavy lifting. Consistent margins, a clear typographic hierarchy and a defined chart style let a reader skim the narrative, then drop into detail. The best examples use pacing and section openers to break a 200-page document into navigable chapters.
Grid discipline is about predictability. A reader who knows where the figures will sit, where the caption belongs, and how the headings nest stops thinking about the layout and starts thinking about the content.
A full-width table with no hierarchy, figures running across eight columns, units buried inside cells, and no headline figure above the grid. A reader skips it.
A headline figure at the top, a three-column table beneath it, units stated once in the header row, and a one-line commentary noting what moved. A reader can engage in under ten seconds.
Two grids do this work, and they are worth naming because reports lose consistency when only one is in place. The baseline grid is the horizontal rhythm: a fixed line of text in one column should sit on the same baseline as the line beside it, so facing pages line up rather than drift. The column grid is the vertical structure that governs where blocks of text and data sit across the page. A flexible choice for an A4 report is a 12-column grid, because twelve divides cleanly into the data zones a report actually needs: a two-column zone for body narrative, three columns for a comparison, four for a dense data table. One grid resolving to several zone widths keeps every spread feeling part of the same system while still flexing to the content.
Typographic hierarchy is where many reports lose consistency mid-document. A legible body face, two or three heading levels, and a clear distinction between display type and body copy is enough. Decorative fonts age a document quickly and undercut legibility at small sizes on screen.
The smaller conventions matter more than they look. Fixing the caption position once, say, always directly below the figure, set in one defined style, removes a decision the team would otherwise re-make on every spread, and a re-made decision is where drift creeps in. A figure-numbering convention does the same job: number the charts and tables so a cross-reference can point to “Figure 12” instead of “the chart on the emissions page,” which also makes the document easier to navigate on screen. Pull quotes follow the same logic. When a callout has one defined treatment and one place it is allowed to sit, it lifts a key line out of the narrative without competing with the headline figures around it.
Section openers are the reader’s map through the document. Without them, a 200-page report becomes one long undifferentiated block. Running section tabs do a similar job on every page. In our 2022 sustainability update for PT Halmahera Persada Lygend, seven tabs run across the top of the page, and the current chapter is picked out in teal.
| Layout element | What strong examples do |
|---|---|
| Grid | A baseline grid plus a column grid (often 12-column) resolving cleanly to 2-, 3- and 4-column data zones |
| Typographic hierarchy | One body face, two to three heading levels, no decorative display fonts |
| Chart styling | One chart template used throughout, labels outside the chart area |
| Section openers | Full-spread dividers with section title and brief orientation text |
| Financial highlights | A designed spread with one dominant figure per panel and detail tables below |
| Pull quotes / callouts | One defined treatment and a fixed position, used to lift a key line without competing with headline figures |
| Captions & figure numbering | A fixed caption position and a figure-numbering convention, so cross-references are precise |
| White space | Generous margins and line spacing, especially in data-heavy sections |
Should an annual report and sustainability report look like one document?
Yes. Whether the content sits in one integrated report or two separate documents, the strongest examples use one visual system across both. The common failure is a sustainability report in a different voice, palette and grid, bolted onto the back of the annual report, which a reader notices at once.
The visual system is the simplest test. If the sustainability section uses different chart colors, a different heading typeface, and a different table format from the financial review, the document is signaling that two teams worked in isolation. A shareholder reading front to back picks up the shift within two pages: two publications filed together instead of one report.
Cross-references between sections are part of the same solution. Where a climate-related risk appears in the financial review, it should look and feel consistent with how it appears in the sustainability section. Shared chart styling ties the two narratives together without making the reader consciously connect them. See our earlier post on what to include and how to structure an annual report for the content architecture that supports this visual approach.
How do you make a report accessible without making it dull?
Accessibility and good design pull in the same direction. Legible type, sufficient color contrast and screen-reader-friendly digital files widen the audience and sharpen the layout at the same time. The Web Content Accessibility Guidelines (WCAG) set a clear, usable floor that improves the report for every reader.
The current WCAG 2.2 Recommendation is organized around four principles, the first of which is “perceivable.” Its text-contrast floor is a contrast ratio of at least 4.5:1 for normal-size text and 3:1 for large-scale text. Both ratios apply to chart labels and legends, not only to body copy. A light gray label on a mid-toned chart background fails that test, and a label that fails the test is harder for everyone to read, not only for readers with low vision. Alongside it sits the separate 3:1 floor for chart segments covered earlier, so a report has two distinct contrast tests to clear in its data graphics: one for the words, one for the shapes.
Alt text for key visuals and a properly tagged PDF structure make the digital edition navigable for screen-reader users. A tagged PDF with a logical reading order is also easier for software to parse, whether that is a search engine or one of the data-extraction tools some analysts now use to pull figures from public filings.
What visual mistakes make an annual report look dated?
A handful of patterns quietly age a report, and each is the first thing a critical reader notices. Recycled photography is the most common: a photograph that appeared in the FY2023 report and reappears in FY2025 signals stagnation to anyone who looks twice. Where a photography refresh is not in scope, the design system should carry the visual weight rather than leaning on stale imagery.
Dense, undesigned tables are the data equivalent. A table where every row looks identical, with units buried inside cells and no visual distinction between a headline figure and a footnote, asks the reader to do the work the design should have done. The fix is the hierarchy from the highlights spread: lead figure, clean rows, units stated once.
Decorative charts are the subtler issue. A chart where 3D effects obscure the values, or where the color coding carries no functional meaning, hides the number instead of showing it. A well-designed chart makes the data the dominant element. See also our post on presenting sustainability data clearly for how this carries across the ESG sections of a report.
A cover that bears no visual relationship to the inside pages is the last of them. It signals the cover was designed in isolation, and it wastes the one spread that should set up the reader’s expectation of the visual system they are about to enter. The remedy is a cover drawn from the same system as the pages behind it.
Examples from recent reports
A few of our own annual reports carry these patterns through to the page. Our Swift Haulage 2024 report set fleet statistics, warehouse capacity and delivery performance into custom infographics, with route maps tracing the company’s logistics corridors. The Sunview Group 2024 report drew its cover and inside pages from one system. The papercut clean-energy landscape on its cover returns on the first two section openers and above the corporate milestones timeline. For the Sarawak Oil Palms 2024 report, the layout was segmented so a reader can move cleanly between the group’s upstream and downstream operations, with sustainability carried in its own section, the Sustainability Report 2024, placed after the management discussion and analysis. The Baiduri Bank 2023 report carried performance metrics and year-on-year trend data through structured grids and one consistent chart convention.
How Walk Production can help
Walk Production is an integrated creative agency that designs and writes annual, sustainability, and integrated reports for listed companies and organizations across Singapore and Asia-Pacific. Our in-house team handles concept development, layout, infographic design, data visualization, and print and digital production under one account team, from cover to filing-ready file.
The most useful first step is to align the visual system with the content architecture before layout begins. A system defined at concept stage holds through to final proof with far less rework than one assembled section by section.
Browse our work to see report examples across sectors, including our annual report for MSIG Insurance (Malaysia) Berhad, or get in touch to talk through the next cycle. Our annual report design page sets out what we cover.